Getting started with analytics
Make sure you get the correct insights by applying filters to your data setTable of Contents
Selecting your filters1. Choose what you want to optimize for2. Pick the campaigns or audiences you want to optimize2.1. Optional advanced filters3. Pick the insights you want to seeThe Analytics feature can help you understand what works in your ads and what doesn’t so you can apply it and optimize your designs to reach much higher results.
But in order to get the right answers, we first must ask the right questions. That is exactly why it’s crucial to understand how to filter the data for insights inside Analytics.
For example, if you want to get better at converting your bottom funnel audiences, also looking at top funnel performance is not going to help, as top and bottom funnel users generally prefer completely different creatives. You’ll need to use filters to only look at how bottom funnel audiences react to your ads to gain actionable insights.
You can filter the insights based on the desired outcome, the campaigns, specific ad sets and many more additional filters. If you’re looking to optimize the number of people that end up purchasing from your ads, it wouldn’t make sense to look at lead generation campaigns - that would be like comparing apples to bananas.
So please, take your time reading this guide and you’ll be on your way to game-changing insights in no time at all!
Selecting your filters
In order to access relevant Analytics, there are 3 steps and filters you need to adjust based on your objective.
First, specifically what you want to optimize; for example ROAS for conversion campaigns or perhaps the Click through rates for traffic campaigns. Then the specific campaigns you want to look at, or what audience you want to gain insights from. Lastly, choose what type of insights you’d like to see.
If you simply look at the average of all your ads, this will not be representative of each type of ad equally.
As an example, your click through rate may be 20% higher when you include a logo in lead generation campaigns, but 20% lower in conversion campaigns. If you combine this into an average, you might incorrectly think that the logo makes no difference and miss out on potential performance improvements.
1. Choose what you want to optimize for
In the first step, there are 2 considerations to make:
What outcome, or metric, you want to look at (i.e. Cost Per Click, Engagement Rate, Return On Ad Spend, etc.)
This is the metric you want to improve and the metric used for all graphs and insights.
This depends on your preferences and reporting standards in your company.
 (1).png)
- What campaign objective you are optimizing for (i.e. Conversions, Lead Generation, Link Clicks, etc.)
The campaign objective is the goal that Facebook is optimizing your advertising for, be it getting leads, or making users buy your products.
This step is important because we often see completely opposite design choices and elements working for different campaigns.
As an example from our broad dataset; conversion campaigns perform better with more text, while traffic campaigns (making people click and visit) perform best with almost no text at all!
This dropdown menu will only show the objectives you are using in your ads.
Please note that you may have to combine more objectives (i.e. OUTCOME_SALES + CONVERSIONS) as they result in the same goal - a user buying from you.
 (1).png)
2. Pick the campaigns or audiences you want to optimize
It is very likely that your campaigns are very different from each other, which is why it may not be a good idea to look at everything. Some of your campaigns may be promoting a discount, while others highlight newly released products, and this requires a separate optimization.
Alternatively, you may have different campaigns for different product categories. Again, these should be seen separately, analyzed and optimized individually.
No matter how you categorize different types of campaigns, simply select 3-10 similar ones, so you can receive relevant insights.
.png)
You can also use the audience filter to only get insights from a specific type of users. This corresponds to the ad sets you are using in your different campaigns. Common ad sets include top-funnel audiences (Broad), bottom-funnel (Custom and Retargeting) and lookalike audiences.
Either analyze certain campaigns, or certain audiences.
And if you really want to go into depth, you can combine these filters and look at only specific audiences in a specific campaign. For example; how do bottom-funnel audiences react to new product releases.
.png)
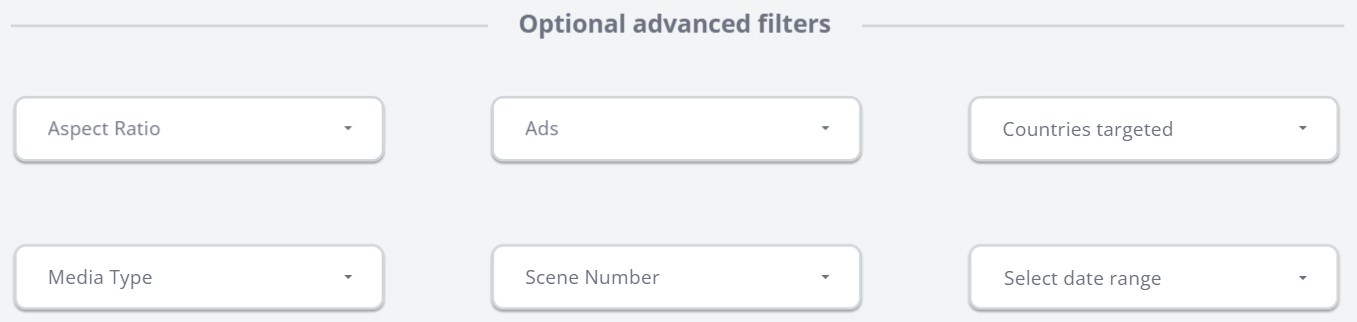
2.1. Optional advanced filters
In addition to the required filters, there is a number of advanced options available. This allows you to filter down even further and look separately at different types of ads if you wish.
You may perhaps want to optimize square (1:1) and story (9:16) ads separately, or look at different countries individually if you believe that each of your markets reacts differently to your designs.
Alternatively, a good use of this is to select a specific date range for former, time-sensitive campaigns such as Christmas or Black Friday.
3. Pick the insights you want to see
The final step is to click on the type of insights you want to analyze. This includes a general overview, platform data, message, design and ad copy insights, as well as examples with the filter you’ve selected.
.png)
No need to spend too much time deciding on this step, you can always click through to a different option.
 (1).png)
All of these insights will now be filtered to only include the data you’ve selected, and display the metric of your choice as the focus point.
We recommend browsing through all the available options and taking note of interesting patterns and differences.